
India’s Official Unemployment Numbers
The Indian government loves to put a number in the press releases.
3.2%.
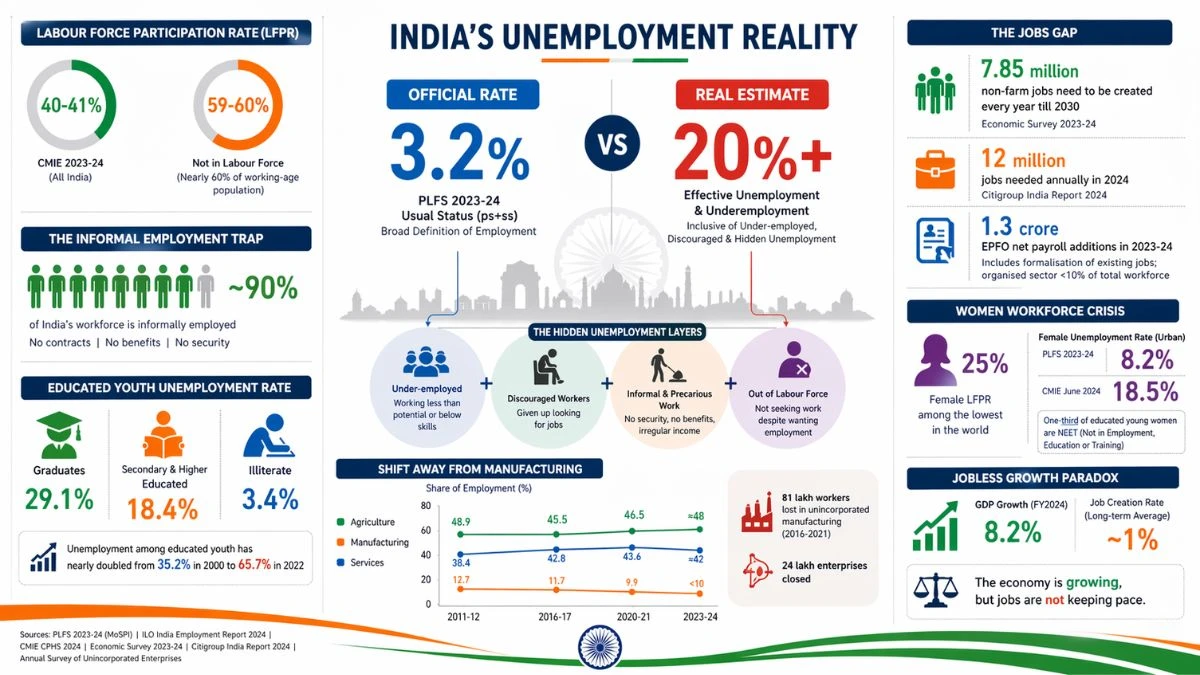
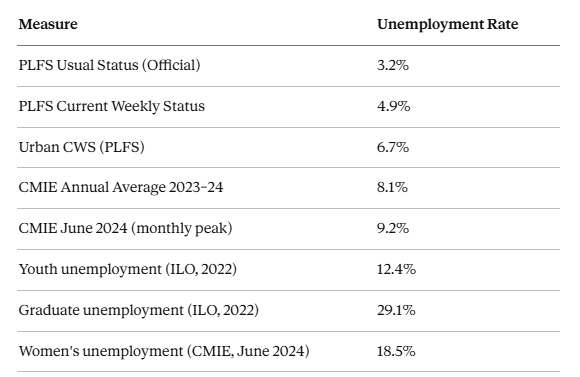
This is the official unemployment numbers in India as reported in Periodic Labour Force Survey (PLFS) 2023 -24 by the Ministry of Statistics and Programme Implementation. It reads well on paper that one of the countries was doing well, a rate that most European countries would sell their foreign reserves to gain. In context, the United States believes that anything less than 5% indicates a healthy labour market.
So 3.2 is good, right, India should be a jobs paradise?

Go to any college campus of any engineering college in Pune, or any job fair in a government office in Lucknow, or a WhatsApp group of MBA graduates in Delhi, and ask that question aloud. The silence which ensues will be better instructive than a government survey.
The following is the fact: The official unemployment rate in India is technically not incorrect. It is constructed upon a definition of employed so broad that it renders nearly everyone employed, even those who have only worked one hour in the last week, or those who have been kept alive on farm labour of which they have not elected to do.
It is not a conspiracy. It is a measurement issue, and it is a measurement issue which economists, the ILO, and even the Chief Statisticians of India have been screaming at each other about over the years.
Now, we shall do the actual math.
The Trick Within the Trick Within Usual Status
In India, there are two main ways of estimating unemployment: Usual Status (ps+ss) and Current Weekly Status (CWS). The Usual Status is the favorite of the government in leading with and herein the first statistical trap.

Under Usual Status, a person is considered to be employed according to what he or she did most of the 365 days in the past. Suppose that you had sold vegetables in a street cart during six months, and had then passed the six following months in vain attempts to find a factory position, you are still recorded as employed in this system. Due to the reason, you were working throughout most of the year.
Better still: with the subsidiary activity clause, anyone who had at least 30 working days in one year in any capacity, whether unpaid, part-time, seasonal, is considered an employed person.
Think about that. One-third of 365 days. 8% of the year is that.

In Current Weekly Status, which is more truthful, India has an all-India unemployment rate of 4.9% in 2024 and in urban areas, it is 6.7%. Unemployment, among men in cities only, increased in reality between 6.0 and 6.1 in that period.
However, 6.7% is not the whole story, as there is another and much more destructive trap: the informal economy.
The 90% Problem When Being Employed is Nothing
The ILO India Employment Report 2024 reported that almost 90% of the workforce in India is informally employed. These are individuals who lack a contract, have no provident fund, no set salary, no sick leave, and have no job security whatsoever.
All these workers are included under the definition of gainful employment under the PLFS.
A woman in rural Bihar that assists her husband in plucking wheat on two weeks during the harvest time is employed. An example is a construction worker of Surat who works on 18 days in a month and spends the remaining days at home. One of the Jaipur graduates who is doing food delivery with Zomato between job applications is a graduate.
The data indicates growth in self-employment activities, which implies that the people are working in order to survive without new jobs, as former Chief Statistician of India Pronab Sen put it, in a blunt way: “It is not that these are all additional jobs created in the economy, it is that people are working in order to survive without new jobs being created in the economy, as I have indicated before.
According to the government itself, the proportion of self-employment in India had increased to 58.4% of the labor force in 202324, compared to 52.2% in 201718, as per the governmental PLFS statistics. It is not an entrepreneurship revolution. It is a survival mechanism. In the meantime, the proportion of regular wage/salaried workers, which indicates a healthy economy, declined to 21.7% in the same period as compared to 22.8%.
India is producing more self-employed individuals and fewer permanent jobs. And the government is covering the second trend with the first one.
Numbers by CMIE The Data that the Government Does Not Quote
The Consumer Pyramids Household Survey (CPHS), a regular survey done by the Centre of Monitoring Indian Economy (CMIE), the most popular economic research organisation in India, has a sample size that in reality is larger than the governmental PLFS survey. And it applies internationally-compliant definitions, which the PLFS, by its own design, does not.
The following is what CMIE discovered:
- In June 2024, India recorded its highest unemployment rate of 9.2%.
- It rose to 8.7 in October 2024, and was over 8% in five of the eight first months of 202425.
- Future average unemployment rates (202324) according to CMIE: 8.1%.
The total Labour Participation Rate in India in CMIE data is only 4041% of the total population, that is, almost 60% of working-age Indians are not even in the labour force.
The latter statistic could use its moment of silence.
A 3.2% rate of unemployment is not only deceptive, but immoral, when almost six out of ten adults of working age are actually not seeking employment at all, not because they are either retired or in school, but because they have just given up.
The reaction of the government to the data of CMIE has been to describe the private surveys as generally neither scientific nor internationally accepted norm. This is, to say the least, ironic, since the definitions of CMIE are more in line with ILO international standards than the government own PLFS is.
The Graduate Paradox An Increase in Education A Decrease in Jobs
This is the figure to be printed in all the university admission forms in India.
The ILO India Employment Report 2024 shows that the rate of unemployment among young graduates in India is 29.1%.
One out of every three graduates is not employed.
This is compared with the unemployment rate of individuals who are illiterate: 3.4%.
You read that right. In India, an individual who has never attended a school has a higher probability of getting employed as compared to a person who has a university degree. Unemployment among the secondary educated or higher is 18.4% which is six times higher than the illiterate.
This is the graduate paradox of India and it is not an exception. It is a structural deficiency.
According to the ILO report youth ages 15-29 make up 83% of the total workforce in India which is unemployed
According to the ILO report, youth (ages 15-29) make up 83% of the total workforce in India, which is unemployed. The proportion of educated young people (secondary level and higher) among the unemployed has increased almost double in 2022 (65.7) compared to 35.2 in 2000. The unemployment rate among the youths rose to 17.5% in 2019 before going down a notch to 12.4% in 2022, which nonetheless is much higher than the rate of 5.7% in 2000.
These are not disillusioned young people, who have unrealistic aspirations. These include engineers working as auto drivers, MBA graduates as data entry operators, postgraduates of science teaching at coaching centres at 8000 monthly wages. Their degrees did not flunk them. Their degrees failed them as the economy did.
The Great Depression in the Factory no one talks about
All great economies of history Germany, Japan, South Korea, China constructed their middle classes by manufacturing. The unskilled rural workers were consumed by factories, trained, and paid wages and were transformed into consumers. Such is the formula.
India tried it. And then hushpuppied it.
According to the Annual Survey of Unincorporated Enterprises, 24 lakh enterprises were closed in the informal manufacturing sector between 2016 and 2021 with a massive 81 lakh workers in the manufacturing sector being laid off. The manufacturing industry, according to the own statistics of CMIE, in 201617 provided 51 million individuals with jobs, which dropped to 27.6 million in 202021.
Manufacturing has fallen out of the top four employers in terms of share of total employment in 202324 (behind agriculture and construction, both low-wage, mostly informal sectors).
What the ILO termed as stunted structural transformation was this. It is expected that economies can shift workers out of farms to factories and services. It appears that India is reversing the situation and bringing people back to farming. The agricultural employment as a share of total employment, which fell as low as 48.9% in 201112, has been increasing since 2016, undoing a decade of improvement.
And when agricultural work is increased in a nation where unemployment is disguised unemployment, where five men have to do the work that two would do, are rife, you are not making jobs. You are concealing their lack.
The Jobs Gap A Figure That Can Not be Hidden
It may be the worst evidence against the official version that is not produced by CMIE or the ILO. It is taken out of the Economic Survey 202324 of the Government of India itself.
According to the survey, it is plain that India must create an average of 78.5 lakh (7.85 million) non-farm jobs annually until 2030 to absorb its swelling workforce.
Citigroup India estimates the job creation necessity, separately in 2024, at 12 million jobs yearly, to absorb new entrants to the labour market.
But just how many formal jobs is India making?
The most direct indicator of formal job creation is EPFO net payroll additions, which was 1.3 crore (13 million) new subscribers in 202324. This number is boasted of by the government. What it does not indicate: EPFO additions are not necessarily new jobs but only the formalisation of existing jobs that are informal. It also only applies to the organised sector which comprises less than 10% of the workforce.
The real truth about the number of new quality jobs that India is generating every year is that: it is much less than the 7.85 to 12 million that it must generate.
The Women Who Just Stopped Counting
The female Labour Force Participation Rate (LFPR) is among the lowest in the world at 25% as of recent ILO statistics, and although PLFS shows an increase to 41.7% in rural areas in 202324, this needs to be questioned.
To a large extent, this “improvement” is being motivated by an augmentation of unpaid family labour in agriculture. Women that are characterized as being helpers in household businesses, those who do not receive remuneration and are employed in family farms are included in the employed category. When an increasing number of women are hitching their family plough, due to the absence of other sources of income, that reflects in the official statistics on female employment.
This is not the entry of women into the workforce. This is the lack of a choice by women.
In the meantime, in cities, the rate of female unemployment was 8.2%., the highest of any kind measured, and even this is upon the generous tally of the PLFS. The rate of unemployment among women as defined by CMIE was 18.5% in June 2024, versus 7.8% in June 2024 among the men.
India has one third of educated young women who are not working, studying or training. This group is referred to as NEET by ILO and the NEET of young women in India has been steadily increasing since 2000.

The Economic Contradiction that defines the Economy of India Jobless Growth
India grew at 8.2% in FY2024. It boasts of the fastest growing major economy in the world. These are facts on the ground.
However, CMIE reports that the job creation rates in India have been at about 1% per year over the decades, despite the growth of GDP at four to eight times that pace.
This is what economists refer to as jobless growth whereby an economy is becoming richer without necessarily having meaningful jobs to offer to ordinary people. The capital-intensive industries in India include financial services, IT, pharma and infrastructure, which are growing. These industries obtain huge profits and make a substantial contribution to GDP. They utilize a small%age of the labour force.
Hundreds of millions of jobs, labour-intensive manufacturing, textiles, leather goods, food processing, the sectors which could have been used, are being hollowed out. India has lost its market in the industries to Vietnam, Bangladesh and Cambodia.
The net effect is an economy that is marvelous at 35,000 feet and is brutal at the ground.
So What Is the Unemployment Real Rate
We will attempt to put together what we know:
When you combine the under-employed, the work which is below their skills and their income requirements, and the discouraged people who have given up, the effective unemployment and underemployment rate in India is probably over 20% by any honest reckonings.
That is not 3.2%.
Why This is Important More than the Statistics
Numbers are abstract on page. And shall we put it into the concrete?
Each year about 1.2 crore young Indians are getting into the labor market. Each year, India is lacking millions of jobs. The wish and the reality become larger each year and each year, official statistics inform the nation that things are improving.
This is not simply a failure to measure. Measurement failure is what allows it to be a policy failure. With decision-makers thinking that unemployment is 3.2, no-one feels the urgent need to re-industrialise policy, no-one is putting on pressure to form manufacturing conglomerates and no-one is pressuring to re-write labour legislation in a manner that would actually generate formal employment.
The figure is a political sedative and deadens the urgency of a crisis that is creeping up, in the young men who scroll job portals at midnight in frustration, in the engineering graduates who spent four years and four lakhs of rupees to get a certificate that cannot get them a 25,000-a-month job, in the women who retreated to the farm of their father because the city had nothing to offer them
The crisis of unemployment in India is a reality. It is structural. It will not be resolved by a statistical definition which regards working one day a week to be a full employment.
The initial way of solving a problem is to measure it squarely.

The Reason Why This is so Difficult to Fix
The transformation of counting unemployment in India is not an easy change of bureaucracy. It would imply admitting an awkward political truth that even with rates of GDP growth high, millions of Indians continue to work in the informal sector, that the so-called demographic dividend of the world is quickly turning into a demographic time bomb.
There are indications of movement. As of 2025 the PLFS is undergoing reform and will have a new sampling design. The CMIE data are becoming more and more referenced in policies. And even the Economic Survey of the government, in accepting that 78.5 lakh new jobs must be created every year, tacitly admits that the existing trend is inadequate.
Surveys will not make employment. Nothing can but honest policy.
Until India is willing to face its unemployment crisis head-on, 8, 15, 20% of it, the 3.2% figure will continue to be what it has always been, not that of the labour market of India, but of how far the official definitions can go to obscure an unwelcome reality.
Frequently Asked Questions (FAQs)
- Is the rate of unemployment in India actually at 3.2%?
The 3.2% is on official survey definitions which count even minimal or irregular work as employment. Although statistically sound in that context, it does not entirely reflect the phenomenon of underemployment, informal employment and discouraged workers who have dropped out of the labour force.
- What is the distinction between PLFS and CMIE data?
Periodic Labour Force Survey (PLFS) is broader in definitions of employment and has several measurement concepts like Usual Status and Current Weekly Status. The Consumer Pyramids Household Survey (CMIE) uses more stringent, internationally-comparable standards and tends to record higher unemployment rates because of more limited definitions of employment.
- What is the big issue with informal employment in India?
Much of the Indian labor force is in the informal sector, which does not have employment contracts, social security, or a regular income. Although these people are being included in the category of the employed, the quality of such work, its security, and sustainability are poor.
- What makes educated youth have higher unemployment rates?
The disparity between learning and labour market demand, the relative lack of creation of high-quality jobs, and slower rate of growth in labour-intensive sectors are all factors that lead to a greater level of unemployment among graduates than less-educated workers.
- What is jobless growth in the Indian case?
Jobless growth is whereby the economy grows in GDP but employment does not follow suit. In India, capital-intensive sectors have been the drivers of growth and they produce fewer jobs compared to the economic output they generate.
Editorial
In this analysis, we have critically analyzed the measure and interpretation of unemployment in India. It is not aimed at challenging the official statistics but putting them in perspective with the realities of the economy as a whole such as underemployment, informal work and gaps in workforce participation.
A single piece of data, out of context, will form a false story. It is an effort to fill that gap in that this piece tries to correlate statistical interpretation with economic behavior on the ground.
This is aimed at promoting critical discussion, knowledge of policy and increased questioning of labour market indicators that have a direct influence on millions of livelihoods.
Disclaimer
The data used in this paper is founded on publicly available reports and data, such as government publications, independent surveys and international organizations. Although utmost effort has been taken to be accurate, the data interpretation may be different in different sources and methodologies.
The information presented here is only informational and analytical and is not professional economic, financial, or policy advice. Readers are advised to refer to official sources and experts in the field in order to have in-depth evaluations.
Sources: PLFS Annual Report 202324 (MoSPI), ILO India Employment Report 2024, CMIE Consumer Pyramids Household Survey 2024, Economic Survey 202324, Citigroup India Report 2024, Annual Survey of Unincorporated Enterprises.
The Vue Times India Analysis, Insights and Explainers.